Friday 31 May 2013

Creating Host level Clustering or Horizontal Clustering for Websphere Application server v8.5

Hi all,
Here are the scenario where we going to discuss the horizontal clustering of Websphere Application servers v8.5. Horizontal clustering, sometimes referred to as scaling out, is adding physical machines to increase the performance or capacity of a cluster pool. Typically, horizontal scaling increases the availability of the clustered application at the cost of increased maintenance. Horizontal clustering can add capacity and increased throughput to a clustered application; use this type of clustering in most instances. Here we have two machines Machine A and Machine B

Prerequisites:

Install WAS ND using the new IBM Installation Manager on both machines.
Create a Deployment Manager profile on Machine A.

Steps to create a node profile on Machine A
  1. Before we create the profile we will log into the Administrative console of our running deployment manager. Navigate to the System administration >Deployment Manager and note down the SOAP Port for Node Creation.
  1. Navigate to the System administration section located in the left-hand-side panel of the admin console. In the Nodes screen we get a listing of the available nodes and their status.
  1. Launch the PMT tool. To launch the PMT tool, On Windows you can use the Programs menu and Click Create the start the wizard
  1. Select Custom profile
  1. Click Next to continue on to the Profile Creation options page and select advanced profile creation. We do not want to use the typical profile creation option as we will be given default profile naming conventions and as we will not be able to decide on the location path for the node profile.
  1. Click Next to move onto the Profile Name and Location screen. enter nodeName in the Profile namefield and change the Profile directory path to be as follows: <was_root>/profiles/ nodeName for example: D:\IBM\WebSphere8\AppServer\profiles\node01
  2. We will not set the “Make this profile the default” field as we want the Deployment manager to be the default profile.
  3. Click Next to move on to the Node and Host Name screen. Enter Testnode01 for both he Node name and localhost for HostName of Machine for Hostname fields.
  1. Click Next to define the node federation options. On this screen we define the location of a running deployment manager. We need to know the hostname and SOAP port of the dmgr. If the dmgr is running on the same machine we can use local host of the hostname as specified in your localhost. When you click next the node will be created and automatically federated in to the dmgr’s managed cell. This node becomes a managed node.The federate this node later option can be used if you wish to post pone federation until another time.
Note:A command line tool called addNode.bat or addNode.sh can be used to federate a node.
  1. Click Next.
  1. On the Security Certificate (Part 2)screen the PMT will set a default certificate for the node.
  2. After verifying the certificate definition for the node, Click Next.
  3. The next screen presented is the Port Values screen. Accept the default, but take note of the ports. Key ports have been incremented by 1 from the dmgr ports. Click Next to review the summary and then click Create to being the Testnode01 profile creation process.
  1. Once the profile creation has finished you is it possible run the First Steps. In this example we will not run the FSC. We are going to start the node manually via the command line.
  2. Click Finish. You will see the PMT profile tab now lists the new Testnode01 profile.
  3. Close the PMT.
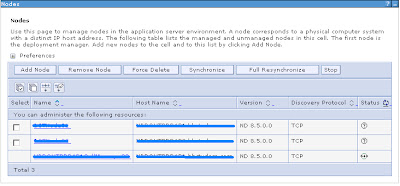
  4. Now that the Testnode01 profile has been created and federated into the cell. We will look into the Administrative console to see the new node is now listed along with the dmgr node. Open the Administrative console and navigate to the System Administration>Nodes section as we did at the beginning of the module. We can now see Testnode01 has been federated into the cell and is now a managed node.

Note: We did not need to restart the Deployment Manager to see the additional node. In older versions of WAS a restart of the dmgr was a requirement.

Steps to create a node profile on Machine B

Follow the same steps to create the Testnode02 on machine B as described for Machine A. But in step 9 while define the node federation options we need to defile the hostname and SOAP port of the dmgr running on the Machine A. Now that the Testnode02 profile has been created and federated into the cell. We will look into the Administrative console to see the new node is now listed along with the dmgr node. Open the Administrative console and navigate to the System Administration>Nodes section as we did at the beginning of the module. We can now see Testnode02 has been federated into the cell and is now a managed node.


Creating cluster in horizontally scaled Cell design Creating a cluster
It is possible to create a cluster in different ways. In our example we will create a JVM on Testnode01, then upgrade it to a cluster and add another clone.

To create a server, follow these steps:
  1. Select Server Type form the Server section located in the left-hand-side of the administrative console, then click WebSphere Application Servers.
  2. In the Application server listing screen, click New.

  1. Within the Create a new application server screen, select Testnode01 (we have two nodes on this system). Type Testserver01 in the server name field. Click Next.


  1. On the following page, select Default template. In production you would use default.
  2. Click Next
  3. The next screen will present an option to turn toggle the Generate unique ports option. This setting generates unique port numbers for every transport that is defined in the source server, so that the resulting server that is created will not have transports which conflict with the original server or any other servers defined on the same node. When you are installing multiple JVMS on the same systems, you can get conflicts with port numbers. If you design your Cell to allow only one single JVM per node, then you could use the default port options, however this can be problematic.
  4. Review and click Finish.

  1. Once the server has been created, click Save to ensure that the configuration is permanently stored.
  2. You can see that the server is currently stopped.
  1. Validating the node synchronisation
  2. If we quickly navigate to the Nodes view, we will see that the Nodes are now out of Sync. To display Node synchronisation status, then navigate to System Administration > Nodes
  3. Below is what you should see, if any of the nodes turn green it means they are one again in sync with the deployment manager.
  4. After a period of time the node will sync.
  5. It is possible for the node and cell configuration to be out of synchronization after this operation is performed. If problems persist, use Full Resynchronize.
Starting the server
We will not start Testserver01 using the console, then we will stop is via the command line after viewing the logs.
  1. Navigate to Servers > Server Types > WebSphere application servers
  2. Now we need to start the server and view the server’s logs.
  3. Select Testserver01 Click Start
  4. Open a command prompt or shell to <was_root>/profiles/Testnode01/logs/Tesrserver01
  5. Open the SystemOut.log
  6. Once you have opened the server’s log file, then scroll to the bottom of the log file and look for line similar to the following:[01/11/11 11:38:45:528 GMT] 00000000 WsServerImpl A WSVR0001I: Server Testserver01 open for e-business
Creating a cluster and clone from an existing server
In this section we take our existing JVM (Testserver01) and make it into a clone (member) of a cluster.
Steps to create a cluster and convert a server into a clone
  1. Navigate to Servers > Clusters > WebSphere application server clusters as seen below.
A list of clusters is presented. We have no cluster at this point, so it is empty. Click New to start the “Create a new cluster” wizard.

  1. Type the name Testcluster01 into the Cluster name field.
  1. Click Next to move onto the Create first cluster member screen. In this example we want to convert an existing server to become a member of this cluster. Select the create the member using an existing application server as a template option as seen below

  1. Click Next to move onto the screen where you can add additional cluster members. In this case we are going to add a new member to TestNode02.
  2. Click the Add member button to add the new cluster member, the result is as seen below.
  1. Click Next to review the final summary screen, and then click Finish to create the cluster.
  2. Click Save to ensure the new cluster is saved.

  1. The WebSphere application servers clusters view will list the current cluster in the cell.
  2. Make sure you are back on the Cluster view screen and click Start
  3. You can see that the Status is Partially started. This is because each member (clone) will be started in sequence and once both servers (members) as started the console will report a green status meaning the cluster if full started. Full started means that all members of the cluster have started. Below is an example for a fully started cluster
  4. We have now completed the essentials of the cluster creation process. What we need to do now is deploy an application to the cluster so we can verify that the Cluster works and we can access each server’s (cluster members) web-container.
Hope this will help you to create a cluster and we will see how deploy an application to the cluster so we can verify that the Cluster works and we can access each server’s (cluster members) web-container in next blog.

Effort only fully releases its rewards after a person refuses to quit”

Regards,
Akhilesh B. Humbe

Monday 27 May 2013

Prepared Statement Discard in Websphere Application Server.


Hi all,
Many of us struggle when it comes down to Prepared Statement Discard issue, what the Prepared Statement Cache in WebSphere Application Server (WAS) is about and how to configure it. This article tries to answer at least some of these questions. 
Introduction Statement cache size:
Statement cache size specifies the number of statements that can be cached per connection. The application server caches a statement after you close that statement.
The WebSphere Application Server data source optimizes the processing of prepared statements and callable statements by caching those statements that are not used in an active connection. Both statement types help maximize the performance of transactions between your application and datastore.
  • A prepared statement is a precompiled SQL statement that is stored in a Prepared Statement object. The application server uses this object to run the SQL statement multiple times, as required by your application run time, with values that are determined by the run time.
  • A callable statement is an SQL statement that contains a call to a stored procedure, which is a series of precompiled statements that perform a task and return a result. The statement is stored in the CallableStatement object. The application server uses this object to run a stored procedure multiple times, as required by your application run time, with values that are determined by the run time.
If the statement cache is not large enough, useful entries are discarded to make room for new entries. To determine the highest value for your cache size to avoid any cache discards, add the number of uniquely prepared statements and callable statements (as determined by the SQL string, concurrency, and the scroll type) for each application that uses this data source on a particular server. This value is the maximum number of possible statements that can be cached on a given connection over the life of the server. Setting the cache size to this value means you never have cache discards. In general, configure a larger cache for applications with a greater number of statements.
Tuning the statement cache improves throughput from 10% to 20%. However, because of potential resource limitations, this might not always be possible.
Observations For Prepared statement discard in PTT:
We can use different tools to observer the prepared statement discard for our WAS environment. It is easy to observe the same through the tool call Websphere Application Server Performance tunning tool kit. Using this tool you will get the output in following two formate.
Fig: Observation From PTT console
Fig: Observation from generated report
Here we get the name of data source for which we need to tune the prepared statement cache size. In this example we have a datasouce of name CMSPool. Which discard 23 prepared statement approximately On the basic of these observation we increasing the size of prepared statement by current size + 20.
Note: Make sure to also talk to your DB administrator. Most often nowadays modern databases have their own PreparedStatement cache mechanism integrated at the DB Server side.
 
Procedure:
1. To access this administrative console page switch to following paths:
Resources > JDBC > Data sources > datasource_name > WebSphere Application Server data source properties


2. Here we are getting the default value of statement cache size 10, change it to 30 and save the changes. 


3. Restart the WAS services once.
Hope this will help you and resolve the issue of Prepared Statement Discard in your environment.

Effort only fully releases its reward after a person refuses to quit.”

Regards,
Akhilesh B. Humbe

Tuesday 21 May 2013

Transaction and Partnerlog recovery issues in WebSphere Process Server

Hi all,

After an abnormal server termination or a database outage, WebSphere Application Server might not start correctly or logs exceptions occurs at that time we came across the scenario of transaction logs. For this issue we normally clear the transaction log and restart the services. But deleting transaction logs in production environments causes some problems.

Here are we going to discuss some basic information about the transaction logs. And what to do when WebSphere Process Server does not start (completely) due to Transaction- and Partnerlog recovery issues

Introduction:

WebSphere Process Server uses the transaction log and partner log files of the underlying WebSphere Process Server installation. The application server acts as the transaction manager and the following log files are used:

<profileName>/tranlog/.../transaction

The tranlog directory contains all of the files that hold record details of transactions that are managed by WebSphere Process Server, in particular the current transition state. The transaction service writes information to the transaction log for every global transaction that involves two or more resources, or that is distributed across multiple servers. The partnerlog directory contains files that hold information on resources that are involved in a transaction. The partnerlog directory is important in a recovery scenario to allow WebSphere Application Server to re-create a resource for recovery after the server is recycled.

When a global transaction is completed, the information in the transaction log is no longer required, and the information is marked for deletion. The redundant information is garbage collected and intervals, and the space is reused by new transactions. The log files are created with a fixed size at server startup, so no further disk space allocation is required during the lifetime of the server.

If all the log space is in use when a transaction needs to save information, the transaction is rolled back and the message 'CWWTR0083W: The transaction log is full.' Transaction rolled back. is reported to the system error log. No more transactions can commit until more log space is made available when existing active transactions complete.

Effects of deleting the transaction or partner log:

Deleting the transaction or partner log file from a WebSphere Process Server environment can cause inconsistencies in active Business Process Execution Language (BPEL) processes or resource adapters that participate in a transaction. If you delete the log files, the processes might not progress or might not complete an outstanding transaction. Also, recovery mechanisms do not work for WebSphere Process Server-related components. Finally, process navigation information remains in the business process engine (BPE) database, and navigation messages remain in the corresponding destinations; the data and messages are not processed.

Do not delete the transaction or partner log file from a production environment.

Without these files, there is no WebSphere Process Server functionality to recover transactional information. In addition, long-running processes remain in an inconsistent state and you cannot complete the process flow except by deleting running instances. This approach might cause you to lose operational or business-critical data, which makes the database inconsistent with the message destination. Other inconsistencies that might be caused by deleting the files are:
  • Started transactions will neither be rolled back nor committed.
  • Artifacts will remain in the Java™ virtual machine (JVM) because they are referenced or allocated by a transaction but never garbage collected.
  • Database content (amongst others navigation state of long running BPEL processes) remains in the Business Process Choreographer related tables and are never deleted.
  • Navigation messages of the Business Process Engine (BPE) of long running processes are never processed further.
  • Service Component Architecture (SCA) messages that belong to a process navigation and transaction remain on SCA-related queues.

Therefore Deleting the transaction log might lead to an inconsistency in your production database. We are not able to recover from this situation. The following document contains more information on the contents of transaction- and partner logs and the effect deleting them can have on your environment:

Complete the following steps to recover in doubt transactions:

1.Start all servers ( in a clustered environment) in recovery mode, using the following command:

profileRoot/bin/startServer.(bat|sh) serverName -recovery

This command using the recovery option causes the server to start and perform only transaction recovery before shutting the server down again.

2.Start the application servers again.

3.Check, using the administrative console, if there are any in doubt transaction left. Navigate to:

Servers > Application Servers > serverName > Container Services > Transaction service > Runtime tab

If remaining in-doubt transactions are listed, select all of them and initiate a rollback.

may this will work fine for you


Effort only fully releases its reward after a person refuses to quit.”

Regards,
Akhilesh B. Humbe

Tuesday 14 May 2013

Websphere: Setup the verbose:gc logging using 'wsadmin' Tool


Hi Everyone,

Execute the following steps to enable the verbose:gc logging in your setup. Or you can use some steps to check the current status of your Java Virtual Machine configuration by using wsadmin tool 
1.Launch the wsadmin. Run these commands in a command prompt window:

:/IBM/WebSphere/AppServer/profiles/AppSrv01/bin

:/IBM/WebSphere/AppServer/profiles/AppSrv01/bin $ ./wsadmin.sh

This output will appear after running the command:

WASX7209I: Connected Node DefaultNode ?process "server1" by SOAP connector Process Type UnManagedProcess

wsadmin>

2. Set the server environment.

wsadmin>set server1 [$AdminConfig getid /Cell:mycell/Node:mynode/Server:server1/]

server1(cells/DefaultNode/nodes/DefaultNode/servers/server1|server.xml#Server_1214551833906)

3.Get the definition of JVM.

wsadmin>set jvm [$AdminConfig list JavaVirtualMachine $server1]

(cells/DefaultNode/nodes/DefaultNode/servers/server1|server.xml#JavaVirtualMachine_1214551833937)

4.Check the current JVM setting.

wsadmin>$AdminConfig show $jvm

{bootClasspath {}}
{classpath {}}
{debugArgs "-Djava.compiler=NONE -Xdebug -Xnoagent -Xrunjdwp:transport=dt_socket.server=y,suspend=n,address=7777"}
{debugMode false}
{disableJIT false}
{genericJvmArguments {}}
{hprofArguments {}}
{initialHeapSize 128}
{maximumHeapSize 256}
{runHProf false}
{systemProperties {}}
{verboseModeClass false}
{verboseModeGarbageCollection false}
{verboseModeJNI false}

5.Set the verboseModeGarbageCollection variable to true.

wsadmin>$AdminConfig modify $jvm {{verboseModeGarbageCollection true}}

6.Check the changed JVM setting.

wsadmin>$AdminConfig show $jvm

{bootClasspath {}}
{classpath {}}
{debugArgs "-Djava.compiler=NONE -Xdebug -Xnoagent -Xrunjdwp:transport=dt_socket,server=y,suspend=n,address=7777"}
{debugMode false}
{disableJIT false}
{genericJvmArguments {}}
{hprofArguments {}}
{initialHeapSize 128}
{maximumHeapSize 256}
{runHProf false}
{systemProperties {}}
{verboseModeClass false}
{verboseModeGarbageCollection true}
{verboseModeJNI false}

7.Save the JVM setting.

wsadmin>$AdminConfig save

8.Close the wsadmin console.

wsadmin>quit

9.Restart the Windows service IBM WebSphere Application Server.

10.Check the verbose:gc logs. By Default, the verbose:gc logs are located here:

/IBM/WebSphere/AppServer/profiles/AppSrv01/logs/server1 $ cat native_stdout.log

/IBM/WebSphere/AppServer/profiles/AppSrv01/logs/server1 $ cat native_stderr.log


Effort only fully releases its reward after a person refuses to quit.”

Regards,
Akhilesh B. Humbe

Thursday 9 May 2013

WebSphere: Enable Automated Heap Dump Generation


Hi all,

Use this task to enable automated heap dump generation in Websphere Application Srver. Manually generating heap dumps at appropriate times might be difficult. To help you analyze memory leak problems when memory leak detection occurs, some automated heap dump generation support is available. This functionality is available only for IBM Software Development Kit on AIX, Linux, and Windows operating systems.This function is not supported when using a Sun Java virtual machine (JVM) which includes WebSphere Application Server running on HP-UX and Solaris operating systems.
Most memory leak analysis tools perform some forms of difference evaluation on two heap dumps. Upon detection of a suspicious memory situation, two heap dumps are automatically generated at appropriate times.

Note:Although heap dumps are only generated in response to a detected memory leak, you must understand that generating heap dumps can have a severe performance impact on WebSphere Application Server for several minutes.

To enable automated heap dump generation support, perform the following steps in the administrative console:

Procedure : 

1.Click Servers > Application servers in the administrative console navigation tree.


2.Click server_name >Performance and Diagnostic Advisor Configuration.


 3.Click the Runtime tab.


 4.Select the Enable automatic heap dump collection check box. 


5.Click OK.

Results:
The automated heap dump generation support is enabled.

Important:
To preserve disk space, the Performance and Diagnostic Advisor does not take heap dumps if more than 10 heap dumps already exist in the WebSphere Application Server home directory. Depending on the size of the heap and the workload on the application server, taking a heap dump might be quite expensive and might temporarily affect system performance.

The automatic heap dump generation process dynamically reacts to various memory conditions and generates dumps only when it is needed. When the heap memory is too low, the heap dumps cannot be taken or the heap dump generation cannot be complete.

Effort only fully releases its reward after a person refuses to quit.”

Regards,
Akhilesh B. Humbe

Popular Posts